
SLB (NYSE: SLB) today announced results for the second-quarter 2026.
This press release features multimedia. View the full release here: https://www.businesswire.com/news/home/20260722694386/en/
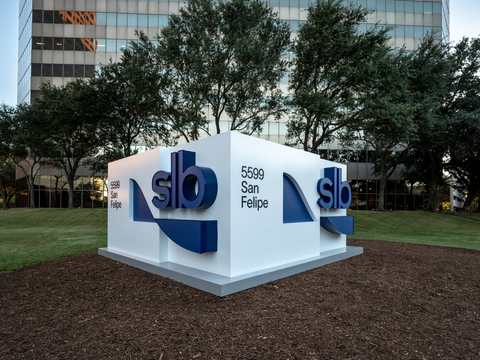
The exterior of the SLB headquarters in Houston, Texas.
| Second-Quarter Results | |||||||||
| (Stated in millions, except per share amounts) | |||||||||
| Three Months Ended | Change | ||||||||
| Jun. 30, 2026 |
Mar. 31, 2026 |
Jun. 30, 2025 |
Sequential | Year-on-year | |||||
| Revenue |
$8,972 |
|
$8,721 |
|
$8,546 |
3% |
|
5% |
|
| Income before taxes – GAAP basis |
$1,018 |
|
$956 |
|
$1,285 |
6% |
|
-21% |
|
| Income before taxes margin – GAAP basis |
11.3% |
|
11.0% |
|
15.0% |
38 bps |
|
-369 bps |
|
| Net income attributable to SLB – GAAP basis |
$786 |
|
$752 |
|
$1,014 |
5% |
|
-22% |
|
| Diluted EPS – GAAP basis |
$0.52 |
|
$0.50 |
|
$0.74 |
4% |
|
-30% |
|
|
|
|
|
|
|
|
|
|
||
| Adjusted EBITDA* |
$1,899 |
|
$1,773 |
|
$2,051 |
7% |
|
-7% |
|
| Adjusted EBITDA margin* |
21.2% |
|
20.3% |
|
24.0% |
83 bps |
|
-284 bps |
|
| Pretax segment operating income* |
$1,404 |
|
$1,321 |
|
$1,584 |
6% |
|
-11% |
|
| Pretax segment operating margin* |
15.6% |
|
15.2% |
|
18.5% |
49 bps |
|
-289 bps |
|
| Net income attributable to SLB, excluding charges & credits* |
$833 |
|
$783 |
|
$1,016 |
6% |
|
-18% |
|
| Diluted EPS, excluding charges & credits* |
$0.55 |
|
$0.52 |
|
$0.74 |
6% |
|
-26% |
|
|
|
|
|
|
|
|
|
|
||
| Revenue by Geography |
|
|
|
|
|
|
|
|
|
| International |
$6,671 |
|
$6,471 |
|
$6,847 |
3% |
|
-3% |
|
| North America |
2,244 |
|
2,167 |
|
1,655 |
4% |
|
36% |
|
| Other |
57 |
|
83 |
|
44 |
n/m |
|
n/m |
|
|
$8,972 |
|
$8,721 |
|
$8,546 |
3% |
|
5% |
||
| SLB acquired ChampionX during the third quarter of 2025. The acquired ChampionX businesses contributed $870 million of revenue, $207 million of adjusted EBITDA and $158 million of pretax segment operating income in the second quarter of 2026. Excluding the impact of this acquisition, SLB’s second-quarter 2026 global revenue decreased 5% year on year; international second-quarter 2026 revenue decreased 6% year on year; and North America second-quarter 2026 revenue decreased 1% year on year. | |||||||||
|
|
|
|
|
|
|
|
|
|
|
| *These are non-GAAP financial measures. See sections titled “Charges & Credits”, “Divisions” and “Supplementary Information” for details. | |||||||||
| n/m = not meaningful | |||||||||
|
(Stated in millions) |
|||||||||
| Three Months Ended | Change | ||||||||
| Jun. 30, 2026 |
Mar. 31, 2026 |
Jun. 30, 2025 |
Sequential | Year-on-year | |||||
| Revenue by Division | |||||||||
| Digital |
$697 |
$640 |
$591 |
9% |
|
18% |
|||
| Reservoir Performance |
1,556 |
1,594 |
1,691 |
-2% |
|
-8% |
|||
| Well Construction |
2,742 |
2,797 |
2,963 |
-2% |
|
-7% |
|||
| Production Systems |
3,771 |
3,508 |
2,932 |
7% |
|
29% |
|||
| All Other |
505 |
443 |
583 |
14% |
|
-13% |
|||
| Eliminations |
(299) |
(261) |
(214) |
n/m |
|
n/m |
|||
|
$8,972 |
$8,721 |
$8,546 |
3% |
|
5% |
||||
|
|
|
|
|||||||
| Pretax segment operating income |
|
|
|
||||||
| Digital |
$194 |
$134 |
$153 |
44% |
|
27% |
|||
| Reservoir Performance |
232 |
257 |
314 |
-10% |
|
-26% |
|||
| Well Construction |
417 |
424 |
551 |
-2% |
|
-24% |
|||
| Production Systems |
586 |
497 |
491 |
18% |
|
19% |
|||
| All Other |
142 |
113 |
155 |
26% |
|
-8% |
|||
| Eliminations |
(167) |
(104) |
(80) |
n/m |
|
n/m |
|||
|
$1,404 |
$1,321 |
$1,584 |
6% |
|
-11% |
||||
|
|
|
|
|||||||
| Pretax segment operating margin |
|
|
|
||||||
| Digital |
27.8% |
20.9% |
25.9% |
683 bps |
|
187 bps |
|||
| Reservoir Performance |
14.9% |
16.1% |
18.6% |
-121 bps |
|
-370 bps |
|||
| Well Construction |
15.2% |
15.2% |
18.6% |
6 bps |
|
-338 bps |
|||
| Production Systems |
15.5% |
14.2% |
16.7% |
138 bps |
|
-120 bps |
|||
| All Other |
28.2% |
25.5% |
26.7% |
267 bps |
|
151 bps |
|||
| Eliminations |
n/m |
n/m |
n/m |
n/m |
|
n/m |
|||
|
15.6% |
15.2% |
18.5% |
49 bps |
|
-289 bps |
||||
|
|
|
|
|||||||
| Adjusted EBITDA |
|
|
|
||||||
| Digital |
$242 |
$167 |
$186 |
45% |
|
30% |
|||
| Reservoir Performance |
349 |
369 |
421 |
-5% |
|
-17% |
|||
| Well Construction |
578 |
584 |
720 |
-1% |
|
-20% |
|||
| Production Systems |
738 |
648 |
582 |
14% |
|
27% |
|||
| All Other |
227 |
197 |
275 |
15% |
|
-17% |
|||
| Eliminations |
(101) |
(37) |
(10) |
n/m |
|
n/m |
|||
|
$2,033 |
$1,929 |
$2,174 |
5% |
|
-6% |
||||
| Corporate & other |
(134) |
(155) |
(123) |
n/m |
|
n/m |
|||
|
$1,899 |
$1,773 |
$2,051 |
7% |
|
-7% |
||||
|
|
|
|
|||||||
| Adjusted EBITDA margin |
|
|
|
||||||
| Digital |
34.7% |
26.1% |
31.5% |
860 bps |
|
324 bps |
|||
| Reservoir Performance |
22.4% |
23.1% |
24.9% |
-73 bps |
|
-248 bps |
|||
| Well Construction |
21.1% |
20.9% |
24.3% |
19 bps |
|
-321 bps |
|||
| Production Systems |
19.6% |
18.5% |
19.9% |
109 bps |
|
-28 bps |
|||
| All Other |
44.9% |
44.4% |
47.2% |
53 bps |
|
-225 bps |
|||
| Eliminations |
n/m |
n/m |
n/m |
n/m |
|
n/m |
|||
|
22.7% |
22.1% |
25.4% |
54 bps |
|
-278 bps |
||||
| Corporate & other |
n/m |
n/m |
n/m |
n/m |
|
n/m |
|||
|
21.2% |
20.3% |
24.0% |
83 bps |
|
-284 bps |
||||
| ChampionX contributed $34 million of Digital revenue and $865 million of Production Systems revenue in the second quarter of 2026. Excluding the impact of this acquisition, Digital second-quarter 2026 revenue increased 12% year on year while Production Systems revenue decreased 1% year on year. | |||||||||
|
|
|||||||||
| n/m = not meaningful | |||||||||
Broad-Based International Growth More than Offset Impact of Middle East Disruptions
“SLB delivered solid second-quarter results, as broad-based sequential growth across international markets — led by offshore activity in Latin America, Europe & Africa and Asia — more than offset the impact of continued disruptions in the Middle East,” said SLB Chief Executive Officer Olivier Le Peuch.
“Excluding the Middle East, revenue grew sequentially across all Divisions, supported by higher offshore activity, a rebound in U.S. unconventionals and strong demand for production and recovery solutions.
“Importantly, this quarter marked a return to year-on-year revenue growth outside the Middle East, reinforcing our view of the favorable investment backdrop for the industry. This growth is driven by customers’ increased focus on energy security, supply diversification, and production capacity expansion,” Le Peuch said.
Production Systems and Digital Drive Sequential Growth
“Production Systems revenue grew 7% sequentially supported by U.S. unconventionals and international markets, as customers increasingly prioritized solutions that enhance production, improve recovery and extend asset life. This drove growth in artificial lift, valves, surface production systems and production chemicals, further highlighting the strategic value of ChampionX in our portfolio.
“Production Systems also benefited from increased subsea activity, reflecting growing momentum in long-cycle offshore investment as customers advance key developments and sanction new projects.
“In Digital, revenue increased 9% sequentially, driven by strong revenue in Digital Exploration, Platforms & Applications, and Digital Operations.
“Digital, AI, and data-driven workflows are playing an increasingly important role in improving subsurface understanding, accelerating decision making, and enhancing operational performance. We continue to see strong demand for these capabilities going forward,” Le Peuch said.
Data Center Solutions Growth Accelerates on Rising Demand and Customer Expansion
“Our Data Center Solutions business maintained its strong growth trajectory during the second quarter, supported by rising demand and customer expansion. Data Center Solutions revenue in the first six months of 2026 grew 63% year on year.
“During the quarter, Meta announced plans for a new 1GW data center in Canada, and we are proud to have been selected as a delivery partner for this project.
“Beyond adding new hyperscaler customers and expanding our footprint internationally, we have widened our scope to include engineering and design. This reflects the strength of SLB’s modular and scalable off-site manufacturing and engineering capabilities — and underscores the significant opportunity ahead to support hyperscaler customers as they accelerate investments in critical digital infrastructure.
“The Data Center Solutions business remains on track to exceed $1 billion annualized revenue run rate by the end of this year. As we broaden our offering and further diversify our customer base and geographic footprint, we expect to surpass $2 billion annualized revenue run rate as we exit 2027,” Le Peuch said.
Strong Foundation for 2027
“Our second-quarter performance demonstrates that growth is broadening across geographies outside the Middle East and spanning both short- and long-cycle resource plays. The regional conflict has heightened the industry’s focus on supply diversification, which is expected to shape the next upcycle and is reinforcing the strategic importance of deepwater, exploration, and production and recovery activities.
“In the Middle East, the first-half revenue decline reflected lower activity and operational disruptions associated with the conflict. While activity began to recover in certain countries during the second quarter, the timing of a full recovery remains uncertain and will depend on a durable resolution of the conflict. As activity improves, we expect the return to full production capacity to take time.
“The recovery will require higher service intensity — particularly in well intervention — as well as increased equipment demand, infrastructure repair and the realignment of shipping logistics. With our differentiated technology, execution capabilities and regional scale, SLB is well positioned to support customers as activity and production normalize.
“Looking ahead, the combination of improving activity in the Middle East, strengthening offshore momentum led by exploration and deepwater, stronger demand for production and recovery solutions, continued Digital growth and increasing adoption of our Data Center Solutions business provides a strong foundation for SLB’s growth heading into 2027,” Le Peuch concluded.
Other Events
During the quarter, SLB repurchased 12 million shares of its common stock for a total purchase price of $648 million.
During the quarter, SLB completed the acquisition of Tachyus Corp., a Houston-based technology company specializing in high-speed reservoir modeling and optimization. This acquisition strengthens SLB’s digital portfolio with differentiated physics-based reservoir modeling capabilities that enable faster reservoir management decisions to maximize recovery. The transaction also helps bridge development planning and production execution across complex and mature assets.
On July 23, 2026, SLB’s Board of Directors approved a quarterly cash dividend of $0.295 per share of outstanding common stock, payable on October 8, 2026, to stockholders of record on September 2, 2026.
Second-Quarter Revenue by Geographical Area
Second-quarter revenue of $8.97 billion increased 3% sequentially with international revenue increasing 3% and North America revenue increasing 4%. Sequential revenue growth was broad-based with revenue increases in North America, Latin America, Europe & Africa, and Asia more than offsetting the 13% revenue decline in the Middle East due to persistent disruptions related to the conflict.
The revenue growth was supported by higher offshore activity, a rebound in U.S. unconventionals, and strong demand for production and recovery solutions.
The ChampionX businesses, acquired in July 2025, contributed $870 million of revenue in the second quarter of 2026, consisting of $606 million in North America and $234 million in the international markets.
Excluding the impact of this acquisition, second-quarter 2026 revenue decreased 5% year on year. International second-quarter 2026 revenue decreased 6% and North America second-quarter 2026 revenue decreased 1% year on year.
|
(Stated in millions) |
|||||||||
| As reported | Three Months Ended | Change | |||||||
| Jun. 30, 2026 |
Mar. 31, 2026 |
Jun. 30, 2025 |
Sequential | Year-on-year | |||||
| North America |
$2,244 |
$2,167 |
$1,655 |
4% |
|
36% |
|||
| Latin America |
1,714 |
1,528 |
1,492 |
12% |
|
15% |
|||
| Europe & Africa* |
2,385 |
2,256 |
2,369 |
6% |
|
1% |
|||
| Middle East & Asia |
2,572 |
2,687 |
2,986 |
-4% |
|
-14% |
|||
| Eliminations & other |
57 |
83 |
44 |
n/m |
|
n/m |
|||
|
$8,972 |
$8,721 |
$8,546 |
3% |
|
5% |
||||
|
|
|
|
|||||||
| International |
$6,671 |
$6,471 |
$6,847 |
3% |
|
-3% |
|||
| North America |
$2,244 |
$2,167 |
$1,655 |
4% |
|
36% |
|||
| *Includes Russia and the Caspian region | |||||||||
| n/m = not meaningful | |||||||||
The following table and commentary are presented on a pro forma basis assuming that ChampionX was acquired on January 1, 2025.
|
(Stated in millions) |
|||||||||
| Pro forma | Three Months Ended | Change | |||||||
| Jun. 30, 2026 |
Mar. 31, 2026 |
Jun. 30, 2025 |
Sequential | Year-on-year | |||||
| North America |
$2,244 |
$2,167 |
$2,219 |
4% |
|
1% |
|||
| Latin America |
1,714 |
1,528 |
1,568 |
12% |
|
9% |
|||
| Europe & Africa* |
2,385 |
2,256 |
2,456 |
6% |
|
-3% |
|||
| Middle East & Asia |
2,572 |
2,687 |
3,075 |
-4% |
|
-16% |
|||
| Eliminations & other |
57 |
83 |
80 |
n/m |
|
n/m |
|||
|
$8,972 |
$8,721 |
$9,398 |
3% |
|
-5% |
||||
|
|
|
|
|||||||
| International |
$6,671 |
$6,471 |
$7,099 |
3% |
|
-6% |
|||
| North America |
$2,244 |
$2,167 |
$2,219 |
4% |
|
1% |
|||
| *Includes Russia and the Caspian region | |||||||||
| n/m = not meaningful | |||||||||
International
Latin America
Revenue in Latin America of $1.71 billion increased 12% sequentially driven by higher SLB OneSubsea™ revenue, increased digital exploration sales and stronger offshore drilling activity in Brazil. The sequential increase was further supported by robust production systems sales in Guyana and Mexico.
Year on year, revenue increased 9% reflecting higher SLB OneSubsea revenue, increased digital exploration sales in Brazil, and strong offshore and land drilling activity across the region.
Europe & Africa
Revenue in Europe & Africa of $2.39 billion increased 6% sequentially. The growth was driven by higher SLB OneSubsea revenue in Scandinavia and Nigeria, increased artificial lift sales in Libya, and stronger intervention and stimulation activity across the area.
Year on year, revenue decreased 3%, primarily due to lower production systems sales in Turkey and Libya, as well as a decline in SLB Capturi™ revenue due to completion of project milestones. These decreases were partially offset by higher stimulation, intervention and evaluation revenue in the UK North Sea, Eastern Europe, Azerbaijan and Turkmenistan.
Middle East & Asia
Revenue in the Middle East & Asia of $2.57 billion decreased 4% sequentially, reflecting a 13% decline in the Middle East, partially offset by a 17% increase in Asia. The Middle East accounted for approximately 65% of the area’s revenue in the second quarter of 2026.
The decline in the Middle East was driven by lower activity levels and operational disruptions related to the regional conflict. While activity began to recover in certain countries as conditions improved, operations in other markets remained constrained by production shut-ins and security challenges. In contrast, Asia delivered double-digit sequential growth, supported by higher drilling activity and increased production systems sales in China, stronger digital exploration sales in Indonesia, and robust SLB OneSubsea revenue in India and Australia.
Year on year, revenue declined 16%, primarily due to the impact of conflict-related disruptions in the Middle East, partially offset by strong growth across Asia.
North America
Revenue in North America of $2.24 billion increased 4% sequentially. The growth was driven by higher sales of production chemicals, artificial lift, and valves in U.S. land, as well as increased revenue from Data Center Solutions. These increases were partially offset by lower drilling activity in Canada due to the spring breakup and reduced digital exploration sales in the Gulf of America.
Year on year, revenue increased 1%, driven by higher offshore drilling in the Gulf of America and strong growth in Data Center Solutions revenue, which increased 80%. These increases were largely offset by the absence of $97 million in Asset Performance Solutions (APS) revenue in Canada following the divestiture of the Palliser project at the end of the second quarter of 2025.
Second-Quarter Results by Division
| Digital | |||||||||
|
(Stated in millions) |
|||||||||
| Three Months Ended | Change | ||||||||
| Jun. 30, 2026 |
Mar. 31, 2026 |
Jun. 30, 2025 |
Sequential | Year-on-year | |||||
| Revenue | |||||||||
| International |
$526 |
$443 |
$462 |
19% |
|
14% |
|||
| North America |
170 |
197 |
126 |
-14% |
|
35% |
|||
| Other |
1 |
– |
3 |
n/m |
|
n/m |
|||
|
$697 |
$640 |
$591 |
9% |
|
18% |
||||
|
|
|
|
|||||||
| Pretax operating income |
$194 |
$134 |
$153 |
44% |
|
27% |
|||
| Pretax operating margin |
27.8% |
20.9% |
25.9% |
683 bps |
|
187 bps |
|||
|
|
|
|
|||||||
| Adjusted EBITDA* |
242 |
167 |
186 |
45% |
|
30% |
|||
| Adjusted EBITDA margin* |
34.7% |
26.1% |
31.5% |
860 bps |
|
324 bps |
|||
| *These are non-GAAP financial measures. See reconciliation in the section “Supplementary Information” for details. | |||||||||
| n/m = not meaningful | |||||||||
|
(Stated in millions) |
|||||||||
| Three Months Ended | Change | ||||||||
| Jun. 30, 2026 |
Mar. 31, 2026 |
Jun. 30, 2025 |
Sequential | Year-on-year | |||||
| Revenue | |||||||||
| Platforms & Applications |
$258 |
$241 |
$266 |
7% |
|
-3% |
|||
| Digital Operations |
148 |
143 |
94 |
3% |
|
57% |
|||
| Digital Exploration |
126 |
101 |
63 |
25% |
|
100% |
|||
| Professional Services |
165 |
155 |
168 |
7% |
|
-1% |
|||
|
$697 |
$640 |
$591 |
9% |
|
18% |
||||
| Digital second-quarter 2026 results include $34 million of revenue from ChampionX. | |||||||||
| n/m = not meaningful | |||||||||
Digital revenue of $697 million increased 9% sequentially, driven by a 25% increase in Digital Exploration revenue resulting from higher sales of exploration data licenses and transfer fees in Brazil and Indonesia. Sequential growth also benefited from higher sales in Platforms & Applications, increased Professional Services and increased adoption of Digital Operations.
Year on year, revenue increased primarily due to growth in Digital Exploration, supported by strong sales in Brazil and Indonesia. Growth was also aided by an increase in Digital Operations revenue. The slight decline in Platforms & Applications was due to lower sales of perpetual licenses, partially offset by growth in SaaS-based revenue.
Annualized Recurring Revenue (ARR) for the Digital Division was $1.04 billion as of June 30, 2026, representing a 15% increase year on year compared with $904 million as of June 30, 2025.
Digital pretax operating margin was 28%, expanding 683 basis points (bps) sequentially, primarily due to higher sales of exploration data licenses and transfer fees, as well as improved profitability in Digital Operations and Platforms & Applications.
Year on year, pretax operating margin expanded 187 bps, reflecting higher sales of exploration data licenses and transfer fees, together with increased profitability in Digital Operations and Platforms & Applications.
For a description of the revenue categories comprising the Digital Division, please refer to Question 10 of the Supplementary Information. Revenue, pretax operating income, and adjusted EBITDA for the Digital Division for the first six months of 2026 and 2025 are provided in Question 11. For the definition of ARR, please refer to Question 12.
|
Reservoir Performance |
|||||||||
|
(Stated in millions) |
|||||||||
| Three Months Ended | Change | ||||||||
| Jun. 30, 2026 |
Mar. 31, 2026 |
Jun. 30, 2025 |
Sequential | Year-on-year | |||||
| Revenue | |||||||||
| International |
$1,409 |
$1,445 |
$1,541 |
-3% |
|
-9% |
|||
| North America |
147 |
143 |
148 |
3% |
|
-1% |
|||
| Other |
0 |
6 |
2 |
n/m |
|
n/m |
|||
|
$1,556 |
$1,594 |
$1,691 |
-2% |
|
-8% |
||||
|
|
|
|
|||||||
| Pretax operating income |
$232 |
$257 |
$314 |
-10% |
|
-26% |
|||
| Pretax operating margin |
14.9% |
16.1% |
18.6% |
-121 bps |
|
-370 bps |
|||
|
|
|
|
|||||||
| Adjusted EBITDA* |
349 |
369 |
421 |
-5% |
|
-17% |
|||
| Adjusted EBITDA margin* |
22.4% |
23.1% |
24.9% |
-73 bps |
|
-248 bps |
|||
| *These are non-GAAP financial measures. See reconciliation in the section “Supplementary Information” for details. | |||||||||
| n/m = not meaningful | |||||||||
Reservoir Performance revenue of $1.56 billion decreased 2% sequentially, primarily due to lower evaluation, stimulation and intervention activity resulting from operational disruptions related to the Middle East conflict. While activity in the Middle East began to recover in certain countries as conditions improved, operations in some Middle East countries remained constrained by production shut-ins and ongoing security challenges. In North America, revenue increased, led by stronger U.S. land activity, despite the impact of the Canadian spring breakup. Revenue in Latin America was slightly lower, as strong growth in offshore Mexico was more than offset by reduced stimulation and intervention activity in Argentina. Revenue in Europe & Africa and Asia increased by double digits sequentially, driven by robust stimulation and intervention activity across the regions.
Year on year, revenue declined 8%, largely reflecting the impact of disruptions associated with the Middle East conflict. Revenue in Latin America was also lower, while revenue in Europe & Africa and Asia increased and North America revenue remained relatively stable.
Reservoir Performance pretax operating margin of 15% contracted 121 bps sequentially primarily due to lower profitability in evaluation and intervention activities, partially offset by improved margins in stimulation.
Year on year, pretax operating margin contracted 370 bps, largely due to the operational disruptions in the Middle East.
| Well Construction | |||||||||
|
(Stated in millions) |
|||||||||
| Three Months Ended | Change | ||||||||
| Jun. 30, 2026 |
Mar. 31, 2026 |
Jun. 30, 2025 |
Sequential | Year-on-year | |||||
| Revenue | |||||||||
| International |
$2,156 |
$2,195 |
$2,394 |
-2% |
|
-10% |
|||
| North America |
549 |
548 |
512 |
0% |
|
7% |
|||
| Other |
37 |
54 |
57 |
n/m |
|
n/m |
|||
|
$2,742 |
$2,797 |
$2,963 |
-2% |
|
-7% |
||||
|
|
|
|
|||||||
| Pretax operating income |
$417 |
$424 |
$551 |
-2% |
|
-24% |
|||
| Pretax operating margin |
15.2% |
15.2% |
18.6% |
6 bps |
|
-338 bps |
|||
|
|
|
|
|||||||
| Adjusted EBITDA* |
578 |
584 |
720 |
-1% |
|
-20% |
|||
| Adjusted EBITDA margin* |
21.1% |
20.9% |
24.3% |
19 bps |
|
-321 bps |
|||
| *These are non-GAAP financial measures. See reconciliation in the section “Supplementary Information” for details. | |||||||||
| n/m = not meaningful | |||||||||
Well Construction revenue of $2.74 billion decreased 2% sequentially, reflecting the impact of disruptions associated with the Middle East conflict. The decline was partially offset by higher offshore drilling activity in Latin America, particularly in Guyana, Brazil and Mexico, as well as increased land drilling activity in Argentina and Ecuador. Revenue in North America was essentially flat, with stronger U.S. land activity being offset by the impact of the Canadian spring breakup. Revenue in Europe & Africa declined slightly, while Asia revenue increased modestly, supported by robust drilling activity in China.
Year on year, revenue declined 7%, primarily due to lower activity resulting from the Middle East conflict. This decrease was partially offset by higher offshore drilling activity in Latin America, Europe & Africa, and the Gulf of America.
Well Construction pretax operating margin of 15% was essentially flat sequentially, as lower profitability in the Middle East was offset by improved profitability in other areas.
Year on year, pretax operating margin contracted 338 bps, primarily due to lower profitability in the Middle East, partially offset by improved profitability in North America and Latin America.
|
Production Systems |
|||||||||
|
(Stated in millions) |
|||||||||
| As reported | Three Months Ended | Change | |||||||
| Jun. 30, 2026 |
Mar. 31, 2026 |
Jun. 30, 2025 |
Sequential | Year-on-year | |||||
| Revenue | |||||||||
| International |
$2,478 |
$2,272 |
$2,243 |
9% |
|
10% |
|||
| North America |
1,259 |
1,206 |
685 |
4% |
|
84% |
|||
| Other |
34 |
30 |
4 |
n/m |
|
n/m |
|||
|
$3,771 |
$3,508 |
$2,932 |
7% |
|
29% |
||||
|
|
|
|
|||||||
| Pretax operating income |
$586 |
$497 |
$491 |
18% |
|
19% |
|||
| Pretax operating margin |
15.5% |
14.2% |
16.7% |
138 bps |
|
-120 bps |
|||
|
|
|
|
|||||||
| Adjusted EBITDA* |
738 |
648 |
582 |
14% |
|
27% |
|||
| Adjusted EBITDA margin* |
19.6% |
18.5% |
19.9% |
109 bps |
|
-28 bps |
|||
| *These are non-GAAP financial measures. See reconciliation in the section “Supplementary Information” for details. | |||||||||
| n/m = not meaningful | |||||||||
Production Systems revenue of $3.77 billion increased 7% sequentially, driven by strong growth in Latin America, Europe & Africa, Asia and North America, despite a decline in the Middle East due to disruptions associated with the regional conflict. Sequential growth was supported by higher revenue from SLB OneSubsea, along with increased sales of artificial lift, valves, surface production systems and completions.
Year on year, revenue increased 29%, primarily reflecting the contribution from the acquired ChampionX production chemicals and artificial lift businesses. These acquired businesses contributed $865 million in revenue and $155 million in pretax operating income during the second quarter of 2026.
Excluding the impact of the acquisition, Production Systems second-quarter 2026 revenue decreased 1% year on year. Strong growth in SLB OneSubsea and valves was more than offset by lower sales of surface production systems, production chemicals, completions and artificial lift, primarily due to disruptions related to the Middle East conflict. Outside the Middle East, Production Systems grew 3% year on year.
Production Systems pretax operating margin was 16%, expanding 138 bps sequentially, driven by improved profitability in SLB OneSubsea and artificial lift. Margin expanded also due to the accretive contribution of ChampionX’s production chemicals and artificial lift businesses. Notably, ChampionX delivered sequential pretax operating margin expansion for the third consecutive quarter.
Year on year, pretax operating margin contracted by 120 bps, primarily due to lower profitability in surface production systems and completions. This decline was partially offset by the accretive contribution from ChampionX’s production chemicals and artificial lift businesses.
The following table and commentary are presented on a pro forma basis assuming that ChampionX was acquired on January 1, 2025.
|
(Stated in millions) |
|||||||||
| Pro forma | Three Months Ended | Change | |||||||
| Jun. 30, 2026 |
Mar. 31, 2026 |
Jun. 30, 2025 |
Sequential | Year-on-year | |||||
| Revenue | |||||||||
| International |
$2,478 |
$2,272 |
$2,496 |
9% |
|
-1% |
|||
| North America |
1,259 |
1,206 |
1,247 |
4% |
|
1% |
|||
| Other |
34 |
30 |
37 |
n/m |
|
n/m |
|||
|
$3,771 |
$3,508 |
$3,780 |
7% |
|
– |
||||
Production Systems revenue of $3.77 billion was essentially flat year on year. Strong growth across Latin America, Europe & Africa, Asia and North America largely compensated for lower revenue in the Middle East, where operations continued to be affected by disruptions associated with the regional conflict.
All Other
All Other is comprised of APS, Data Center Solutions and SLB Capturi.
Revenue increased 14% sequentially due to 33% higher revenue in Data Center Solutions while APS revenue was flat. Year on year, revenue declined 13%, primarily due to lower APS revenue following the divestiture of the Palliser asset in Canada at the end of the second quarter of 2025, coupled with reduced revenue in SLB Capturi. This decline was partially offset by an 80% increase in Data Center Solutions revenue.
Pretax operating income increased sequentially due to improved profitability in Data Center Solutions and APS. Pretax operating income declined year on year due to lower profitability in APS projects following the Palliser divestiture.
Quarterly Highlights
Core
Contract Awards
SLB continues to win new contract awards that align with SLB’s strengths in the Core. Notable highlights include the following:
- In the Gulf of America, SLB OneSubsea joint venture was awarded a contract by bp to provide a subsea boosting system for the Thunder Horse deepwater development project. This engineering, procurement and construction contract for Thunder Horse follows recent subsea boosting contract awards for bp’s Kaskida and Tiber developments. All three projects leverage the same supplier-led, standardized subsea boosting system solution, which helps improve execution efficiency and shorten delivery times.
- Also, in the Gulf of America, SLB OneSubsea was awarded a contract by Beacon Offshore Energy Exploration and Production LLC to deliver a high‑pressure, high‑temperature (HPHT) multiphase boosting system for the Shenandoah field. The award reflects continued investment in deepwater developments, where advanced subsea production systems are being applied to improve recovery. OneSubsea’s HPHT multiphase boosting system is engineered to operate reliably above 15,000 psi, addressing operating conditions that exceed the limits of conventional subsea solutions.
- Offshore Indonesia, SLB OneSubsea was awarded a contract by Eni North Ganal Limited (a subsidiary of Searah Limited, a joint venture company between Eni and PETRONAS) to deliver a steel tube umbilical system for the Kutei North Hub field development project in East Kalimantan. Supporting one of the region’s most significant deepwater developments, OneSubsea will engineer, procure and manufacture 94.6 kilometers of umbilical for water depths of up to 2,200 meters. With a total system weight of approximately 6,700 tons, the project represents one of the largest umbilical contracts awarded in the industry to date.
- In Kuwait, SLB was awarded a seven-year contract by Kuwait Oil Company (KOC) under the Ahmadi Innovation Valley initiative. The agreement will support applied research, technology deployment and digital innovation programs aligned with Kuwait’s long-term energy objectives. Under the agreement, SLB will work with KOC to evaluate, test and deploy advanced technologies across a range of operational and strategic priorities, including AI, industrial internet of things (IIoT) applications, production optimization, reservoir technologies, water management and energy transition initiatives.
- Also in Kuwait, KOC awarded SLB a five-year contract to deliver bits for both land and offshore drilling operations as well as a significant contract award for cementing and related services in conventional and unconventional scopes. SLB will deploy advanced bits and reverse circulation technologies tailored for KOC’s subsurface environment, addressing the complexity of local geological conditions. These high-performance drilling solutions are engineered to enhance efficiency and reduce well construction costs. The cementing award underscores SLB’s commitment to innovative technologies, operational excellence and sustainable value — all while supporting KOC in driving safety, performance and long-term value creation in Kuwait.
- In India, Oil and Natural Gas Corporation (ONGC) awarded SLB a significant deepwater drilling contract to support the drilling of 24 wells over four years for its offshore energy development. Under the agreement, SLB will deliver integrated drilling services and technologies to support efficient execution in complex deepwater environments. By combining advanced drilling technologies, digital workflows and deep domain expertise, SLB will optimize well performance, improve operational efficiency and reduce execution risk across the campaign. The project supports ONGC’s strategy to accelerate domestic hydrocarbon production through efficient and cost-effective offshore development while reinforcing SLB’s position as a trusted partner for complex deepwater projects in India.
- PTT Exploration and Production (PTTEP) awarded SLB a two-year managed pressure drilling (MPD) contract for offshore exploration. The scope includes a full MPD and pressurized mudcap drilling solution, powered by a custom compact above-tension-ring rotating control device and @balance Control™ MPD system. This achievement highlights SLB’s ability to deliver customized solutions for complex drilling environments and underscores the strength of the partnership with PTTEP. Through this collaboration, SLB continues to enhance operational efficiency and safety, reinforcing the commitment to excellence in service delivery.
- Offshore Côte d’Ivoire, SLB OneSubsea was awarded a major multiwell engineering, procurement and construction contract by Eni for Phase 3 of the deepwater Baleine project. Under the contract, OneSubsea will deliver complete subsea production systems for 13 wells, reinforcing its role as a core technology and execution partner on one of the most strategically significant offshore developments currently underway in the region.
Technology Highlights
Notable technology introductions and deployments in the quarter include the following:
- During the inaugural SLB Production and Recovery Summit, SLB launched its Intelligent Production Studio, an environment for digital operations. The live operating environment integrates AI, edge intelligence, connected equipment, digital twins and autonomous workflows, to show an intelligent production system in action. Built around a fully autonomous well pad managing real three-phase flow of oil, water and gas across multiple well streams, the studio enables customers to evaluate interconnected, intelligent production systems before field deployment. The facility models surveillance, anomaly detection, robotic inspection, autonomous chemical injection and closed-loop optimization to aid in field design decisions.
- SLB launched AlphaSight™, the company’s latest innovation in reservoir mapping and drilling intelligence. The AlphaSight service leverages industry-first technologies, setting a new benchmark for visibility and control in complex drilling environments to maximize production potential. Designed to deliver clearer subsurface insight at significantly further depths, the AlphaSight service helps operators see and understand reservoir structures in real time — supporting confident drilling decisions without slowing performance.
- Retina™ at-bit imaging system achieved strong market adoption in its first year of commercialization, with deployments in more than 50 wells across 16 locations worldwide and over 122,000 feet of data acquired. By providing high-resolution formation measurements at first contact with the rock, the Retina system delivers earlier subsurface visibility, helping operators reduce uncertainty and make more informed drilling, completion and reservoir development decisions. Successful deployments in the Gulf of America, U.S. land, East Asia and the Middle East demonstrated the system’s value across a wide range of geological and operational environments, reinforcing its growing role in improving well placement and reservoir understanding.
- In North Africa, SLB applied an integrated approach, focusing on production enhancement, to help an operator rejuvenate a 50-year-old mature onshore field challenged by declining production, rising water cut, idle wells and legacy facilities. The multidisciplinary solution combined advanced reservoir diagnostics, targeted well interventions, facility debottlenecking and digital operations under a unified delivery model. The project unlocked 13.8 million barrels of incremental oil, delivered production results three times higher than initial forecasts, brought 90 wells online and reduced produced water volumes by 55%, demonstrating the impact of SLB’s integrated technology and execution model in improving recovery and operational efficiency across mature assets.
- In the United Arab Emirates, SLB collaborated with a national oil company to reactivate shut-in wells in a mature onshore field using Production Express™ rapid production response solutions. The mobile surface multiphase boosting deployment increased wellhead pressure by 300 psi, restoring stable production of more than 3 million standard cubic feet per day of gas and more than 7,000 barrels per day of liquids. The solution enabled zero-flaring operations, reduced emissions for the operator and established a qualified pathway for future multiphase boosting and zero-flaring projects across onshore and offshore wells.
- Following commercialization in the first quarter of 2026, SLB’s automated cementing technology has rapidly evolved from a pioneering digital innovation into a scalable commercial solution. Building on the industry’s first fully automated cementing job in Norway, the technology has now surpassed 100 remote and automated cementing jobs, validating years of investment in automation, digital workflows and remote operations. Additionally, a key milestone was recently achieved with its first deployment in Egypt, where the cementing team successfully executed an automated dual-slurry operation on Shell’s Velox-1 well, demonstrating the technology’s scalability and supporting SLB’s competitive differentiation in digital well construction.
- In the Gulf of America, SLB helped restore production from a deepwater well that had been shut in for nearly four years because of sand production challenges. Using RemedySlot™ through tubing sand screens as a targeted remedial solution, SLB avoided a full recompletion and completed the intervention in 101 hours. The well returned to stable production of more than 900 barrels per day, protecting critical subsea equipment and recovering value for the customer.
- Across Kuwait, SLB and KOC advanced integrated water-control and injector-conformance workflows, combining powered, fiber-optic ACTive™ real-time downhole coiled tubing services, high-resolution diagnostics and engineered chemical water shutoff systems to restore reservoir performance without conventional rig workover. Across three producer and injector interventions, the workflows reduced water cut, improved injection conformance and delivered measurable oil production gains. Results included uplift to about 975 and 1,200 barrels of oil per day in two producers. The injector intervention also delivered approximately 2,100 barrels of oil per day of incremental oil from five surrounding producers, demonstrating a repeatable diagnose-to-remediate model for improved recovery. Better-connected decisions enabled fewer, more effective interventions to reduce cost while sustaining production.
Digital
SLB is deploying digital technology at scale, partnering with customers to migrate their technology and workflows into the cloud, to embrace new AI-enabled capabilities, and to leverage insights to elevate their performance. Notable highlights include the following:
- SLB signed a long-term framework agreement with Petróleos de Venezuela, S.A. (PDVSA) to support the revitalization and modernization of Venezuela’s oil and gas sector. The MoU establishes a basis for cooperation across exploration, field development, production, digital enablement and workforce training and development. The collaboration is intended to strengthen operational execution and promote sustainable development of Venezuela’s hydrocarbon resources. It builds on SLB’s 97 years of presence in the country and reflects a shared focus on combining technology, local capability and continued sector development.
- SLB launched its Digital Marketplace, a curated digital destination designed to help energy companies rapidly discover and deploy specialized AI agents, domain models, skills, tools, data connectors and digital applications within their existing digital environments. The SLB Digital Marketplace extends the company’s open platform strategy to its Tela™ agentic AI assistant by enabling SLB, partners, independent software vendors, developers and customers to bring purpose-built digital capabilities to the energy industry through a single, governed channel. All marketplace offerings are certified to SLB standards for security, interoperability and compatibility before listing.
- SLB announced a memorandum of understanding (MoU) with Qualcomm Technologies, Inc. to enable edge AI solutions for the energy industry, supporting real-time operational decision making across wells, facilities and production systems. The collaboration combines Qualcomm Technologies’ low-power edge computing and AI processing capabilities, with SLB’s Agora™ edge AI and IIoT solutions developed for remote and operationally complex environments. The companies will focus on enabling AI applications across production operations using SLB’s digital production solutions and energy domain expertise together with Qualcomm Technologies’ low-power edge computing capabilities. The collaboration reflects growing industry interest in bringing AI closer to operations to support more autonomous and resilient energy systems.
- SLB announced an expanded collaboration with Vår Energi to scale well planning and integrated field development planning across its Norwegian Continental Shelf operations. With collaborative well planning already reducing cycle times from months to days and integrated field development planning expected to support similar benefits, the expanded deployment is designed to support faster, more consistent decision making as operators work to sustain production from mature offshore assets while managing increasing development complexity.
- Offshore southern Brazil, SLB is participating with TGS in Pelotas Sul Phase 1, a 13,500-square kilometer multiclient 3D seismic program. Building on a 2D data library developed since 2015, the survey expands SLB’s multiclient data footprint in Brazil and supports growing exploration interest in the Pelotas Basin. Acquisition is underway and expected to finish early in the third quarter of 2026. The program will provide high-quality subsurface data to help operators better evaluate largely untested deepwater opportunities across the basin.
- In the North Sea, Adura awarded SLB a contract to scale integrated digital workflows across its subsurface and production domains. SLB is delivering a multidomain program that connects data, drilling, subsurface and production workflows, anchored by Petrel™ subsurface software standardization and the OptiFlow™ production assurance solutions. The program is designed to improve near-term performance through faster deployment and disciplined commercial execution, while advancing next-generation production workflows and supporting broader digital adoption across the basin.
- SLB was awarded a contract by bp for seismic data processing for the Karabagh project in the Caspian Sea. This award follows two previous contract awards on other offshore oil and gas projects operated by bp in the Caspian. SLB’s deep regional expertise and longstanding presence in Azerbaijan, combined with consistent delivery of high-quality imaging and actionable reservoir insights, continue to set the standard for seismic performance in the Caspian basin.
- In Kuwait, KOC, as part of its Kuwait Digital Integrated Field for Jurassic gas, awarded SLB four Innovation Factori™ AI collaborations. The awards include AI‑driven rig scheduling, generative AI production analytics, AI‑based log quality control and reconstruction to accelerate field development, and a three‑month AI academy to upskill KOC subject matter experts by equipping them with the most relevant and practical AI capabilities. KOC advances digital transformation across upstream operations by deploying generative AI solutions to enhance production insights, asset management and operational efficiency.
- In India, ONGC awarded SLB a three-year, enterprise-wide contract to deploy its DrillOps™ intelligent well delivery and insights solutions across onshore and offshore operations. As part of ONGC’s real-time data monitoring, management and analytics initiative, the deployment covers up to 120 rigs and includes real-time monitoring, predictive analytics and performance insights. Through centralized real-time operations at ONGC’s Institute of Drilling and Well Engineering in Dehradun, the deployment will help improve drilling consistency and performance across ONGC’s drilling portfolio.
- SLB was awarded a contract by PTTEP to pilot the deployment of Cognite Data Fusion, OptiFlow solutions and Tela™ AI advisory agents for a domestic offshore asset. This achievement represents a significant milestone in the collaboration between the SLB Innovation Factori team and PTTEP, providing a scalable data foundation and production assurance, in addition to well optimization solutions aimed at enhancing operational efficiency and supporting better decision making.
- In China, SLB worked with China France Bohai Geoservices Co., a subsidiary of China National Offshore Oil Company, to promote one of its offshore terminal’s process performance by turning operational data into real-time action. Leveraging Innovation Factori AI collaboration, SLB integrated plant operational data with Symmetry™ process simulation software (configured as digital twins) and connected the solution to advanced process control and distributed control systems. This enabled closed-loop, real-time economic optimization beyond traditional offline studies, improving efficiency, generating actionable insights and creating sustained value through digital process optimization.
- ExxonMobil Trinidad and Tobago Deepwater Limited awarded SLB a two-year seismic data processing project to support frontier exploration in an ultra-deepwater area. The block presents one of the industry’s most complex imaging challenges, with only sparse legacy 2D seismic data available. SLB will apply advanced seismic processing and depth-imaging workflows in its Omega™ geophysical data processing software. The workflow combines full-waveform inversion, velocity modeling, advanced source-separation technology, multicomponent streamer data processing and AI-enabled horizon interpretation. Covering nearly 6,000 square kilometers, the program will deliver the block’s first 3D image and give ExxonMobil a clearer path to evaluate this new frontier.
New Horizons of Growth
SLB is participating in high-growth markets like Data Center Solutions, through strategic innovative technology and partnerships, including the following:
- In Canada, Meta announced a new 1GW data center to be built in Sturgeon County, Alberta, for which SLB has been selected as a delivery partner. This partnership, spanning from modular infrastructure manufacturing to building fit-out, underscores SLB’s evolving position as a full-scale deployment partner for leading global hyperscalers.
- SLB and Ormat Technologies have selected Desert Peak in Nevada as the preferred location for a planned enhanced geothermal system (EGS) pilot, following a multisite evaluation across existing geothermal fields. SLB and Ormat’s approach is to improve development predictability and reduce execution risk in complex geothermal environments, and to industrialize EGS. Following the pilot, SLB and Ormat plan to collaborate to accelerate the commercialization of large-scale EGS solutions for customers, including data center operators, building on the companies’ October 2025 agreement to co-develop integrated geothermal assets and progress EGS from pilot to commercial deployment.
- SLB and Liberty Energy Inc. announced an agreement to form a strategic alliance that will deliver modular infrastructure and integrated power generation solutions for new data center projects globally. Under the planned alliance, SLB will provide modular infrastructure solutions, project execution capabilities and global market reach, while Liberty will provide modular behind-the-meter power generation systems, intelligent power controls and operational expertise. The collaboration intends to support the rapid deployment of new data center capacity and help the world’s leading AI companies address increasingly complex energy requirements.
FINANCIAL TABLES
Condensed Consolidated Statement of Income
|
(Stated in millions, except per share amounts) |
|||||||
| Second Quarter | Six Months | ||||||
|
2026 |
|
2025 |
|
2026 |
|
2025 |
|
| Revenue |
$8,972 |
$8,546 |
$17,693 |
$17,035 |
|||
| Interest & other income |
76 |
252 |
119 |
330 |
|||
| Expenses | |||||||
| Cost of revenue (1) |
7,577 |
6,934 |
14,967 |
13,815 |
|||
| Research & engineering |
171 |
180 |
335 |
352 |
|||
| General & administrative |
84 |
87 |
181 |
184 |
|||
| Impairments & other (1) |
69 |
35 |
110 |
84 |
|||
| Restructuring & other (1) |
– |
135 |
– |
293 |
|||
| Interest |
128 |
142 |
244 |
289 |
|||
| Income before taxes (1) |
$1,019 |
$1,285 |
$1,975 |
$2,348 |
|||
| Tax expense (1) |
204 |
237 |
399 |
471 |
|||
| Net income (1) |
$815 |
$1,048 |
$1,576 |
$1,877 |
|||
| Net income attributable to noncontrolling interests (1) |
29 |
34 |
38 |
66 |
|||
| Net income attributable to SLB (1) |
$786 |
$1,014 |
$1,538 |
$1,811 |
|||
| Diluted earnings per share of SLB (1) |
$0.52 |
$0.74 |
$1.02 |
$1.32 |
|||
| Average shares outstanding |
1,490 |
1,352 |
1,494 |
1,359 |
|||
| Average shares outstanding assuming dilution |
1,506 |
1,366 |
1,511 |
1,373 |
|||
| Depreciation & amortization included in expenses (2) |
$712 |
$633 |
$1,397 |
$1,273 |
|||
|
(1) |
See section entitled “Charges & Credits” for details. |
|
|
(2) |
Includes depreciation of fixed assets and amortization of intangible assets, exploration data costs, and APS investments. |
Condensed Consolidated Balance Sheet
|
(Stated in millions) |
|||
| Jun. 30, | Dec. 31, | ||
| Assets |
2026 |
2025 |
|
| Current Assets | |||
| Cash and short-term investments |
$4,071 |
$4,212 |
|
| Receivables |
9,132 |
8,689 |
|
| Inventories |
5,436 |
5,032 |
|
| Other current assets |
1,605 |
1,580 |
|
|
20,244 |
19,513 |
||
| Investment in affiliated companies |
1,691 |
1,783 |
|
| Fixed assets |
7,745 |
7,894 |
|
| Goodwill |
17,001 |
16,794 |
|
| Intangible assets |
4,876 |
4,988 |
|
| Other assets |
3,975 |
3,896 |
|
|
$55,532 |
$54,868 |
||
| Liabilities and Equity | |||
| Current Liabilities | |||
| Accounts payable and accrued liabilities |
$11,210 |
$11,490 |
|
| Estimated liability for taxes on income |
742 |
894 |
|
| Short-term borrowings and current portion | |||
| of long-term debt |
1,658 |
1,894 |
|
| Dividends payable |
456 |
443 |
|
|
14,066 |
14,721 |
||
| Long-term debt |
11,140 |
9,742 |
|
| Other liabilities |
3,072 |
3,114 |
|
|
28,278 |
27,577 |
||
| Equity |
27,254 |
27,291 |
|
|
$55,532 |
$54,868 |
||
Liquidity
|
(Stated in millions) |
|||||||
| Components of Liquidity | Jun. 30, 2026 |
Mar. 31, 2026 |
Jun. 30, 2025 |
Dec. 31, 2025 |
|||
| Cash and short-term investments |
$4,071 |
$3,387 |
$3,747 |
$4,212 |
|||
| Short-term borrowings and current portion of long-term debt |
(1,658) |
(1,938) |
(2,807) |
(1,894) |
|||
| Long-term debt |
(11,140) |
(9,670) |
(10,891) |
(9,742) |
|||
| Net Debt (1) |
$(8,727) |
$(8,221) |
$(9,951) |
$(7,424) |
|||
| Details of changes in liquidity follow: | |||||||
| Six | Second | Six | |||||
| Months | Quarter | Months | |||||
| Periods Ended June 30, |
2026 |
2026 |
2025 |
||||
| Net income |
$1,576 |
$815 |
$1,877 |
||||
| Gain on sale of APS project |
– |
– |
(149) |
||||
| Impairment of equity method investment |
– |
– |
69 |
||||
| Depreciation and amortization (3) |
1,397 |
712 |
1,273 |
||||
| Stock-based compensation expense |
179 |
78 |
168 |
||||
| Change in working capital |
(1,344) |
(242) |
(1,401) |
||||
| Other |
38 |
(4) |
(35) |
||||
| Cash flow from operations |
$1,846 |
$1,359 |
$1,802 |
||||
| Capital expenditures |
(802) |
(459) |
(769) |
||||
| APS investments |
(226) |
(123) |
(225) |
||||
| Exploration data capitalized |
(125) |
(61) |
(83) |
||||
| Free cash flow (3) |
693 |
716 |
725 |
||||
| Stock repurchase program |
(1,099) |
(648) |
(2,300) |
||||
| Dividends paid |
(866) |
(440) |
(773) |
||||
| Proceeds from employee stock plans |
211 |
33 |
113 |
||||
| Business acquisitions and investments, net of cash acquired plus debt assumed |
(249) |
(179) |
(47) |
||||
| Proceeds from sale of APS project |
– |
– |
316 |
||||
| Taxes paid on net settled stock-based compensation awards |
(63) |
(4) |
(55) |
||||
| Other |
(42) |
(12) |
(30) |
||||
| Increase in Net Debt before impact of changes in foreign exchange rates |
(1,415) |
(534) |
(2,051) |
||||
| Impact of changes in foreign exchange rates on net debt |
112 |
28 |
(495) |
||||
| Increase in Net Debt |
(1,303) |
(506) |
(2,546) |
||||
| Net Debt, beginning of period |
(7,424) |
(8,221) |
(7,405) |
||||
| Net Debt, end of period |
$(8,727) |
$(8,727) |
$(9,951) |
||||
|
(1) |
“Net Debt” represents gross debt less cash and short-term investments. Management believes that Net Debt provides useful information to investors and management regarding the level of SLB’s indebtedness by reflecting cash and investments that could be used to repay debt. Net Debt is a non-GAAP financial measure that should be considered in addition to, not as a substitute for or superior to, total debt. |
|
|
(2) |
Includes depreciation of fixed assets and amortization of intangible assets, exploration data costs, and APS investments. |
|
|
(3) |
“Free cash flow” represents cash flow from operations less capital expenditures, APS investments, and exploration data costs capitalized. Management believes that free cash flow is an important liquidity measure for the company and that it is useful to investors and management as a measure of SLB’s ability to generate cash. Once business needs and obligations are met, this cash can be used to reinvest in the company for future growth or to return to shareholders through dividend payments or share repurchases. Free cash flow does not represent the residual cash flow available for discretionary expenditures. Free cash flow is a non-GAAP financial measure that should be considered in addition to, not as a substitute for or superior to, cash flow from operations. |
Charges & Credits
In addition to financial results determined in accordance with US generally accepted accounting principles (GAAP), this second-quarter 2026 earnings release also includes non-GAAP financial measures (as defined under the SEC’s Regulation G). In addition to the non-GAAP financial measures discussed under “Liquidity”, SLB net income, excluding charges & credits, as well as measures derived from it (including diluted EPS, excluding charges & credits; effective tax rate, excluding charges & credits; adjusted EBITDA and adjusted EBITDA margin) are non-GAAP financial measures. Management believes that the exclusion of charges & credits from these financial measures provides useful perspective on SLB’s underlying business results and operating trends, and a means to evaluate SLB’s operations period over period. These measures are also used by management as performance measures in determining certain incentive compensation. The foregoing non-GAAP financial measures should be considered in addition to, not as a substitute for or superior to, other measures of financial performance prepared in accordance with GAAP. The following is a reconciliation of certain of these non-GAAP measures to the comparable GAAP measures. For a reconciliation of adjusted EBITDA to the comparable GAAP measure, please refer to the section titled “Supplementary Information” (Question 8).
|
(Stated in millions, except per share amounts) |
|||||||
| Second Quarter 2026 | |||||||
| Pretax | Tax | Noncont. Interests |
Net | Diluted EPS |
|||
| Net income attributable to SLB (GAAP basis) |
$1,019 |
$204 |
$29 |
$786 |
$0.52 |
||
| Merger and integration (1) |
69 |
19 |
3 |
47 |
0.03 |
||
| Net income attributable to SLB, excluding charges & credits |
$1,088 |
$223 |
$32 |
$833 |
$0.55 |
||
| First Quarter 2026 | |||||||
| Pretax | Tax | Noncont. Interests |
Net | Diluted EPS |
|||
| Net income attributable to SLB (GAAP basis) |
$956 |
$195 |
$9 |
$752 |
$0.50 |
||
| Merger and integration (1) |
41 |
8 |
2 |
31 |
0.02 |
||
| Net income attributable to SLB, excluding charges & credits |
$997 |
$203 |
$11 |
$783 |
$0.52 |
||
| Second Quarter 2025 | |||||||
| Pretax | Tax | Noncont. Interests |
Net | Diluted EPS |
|||
| Net income attributable to SLB (GAAP basis) |
$1,285 |
$237 |
$34 |
$1,014 |
$0.74 |
||
| Impairment of equity method investment (2) |
69 |
12 |
– |
57 |
0.04 |
||
| Workforce reductions (2) |
66 |
3 |
– |
63 |
0.05 |
||
| Merger & integration (1) |
35 |
4 |
4 |
27 |
0.02 |
||
| Gain on sale of Palliser APS project (3) |
(149) |
(4) |
– |
(145) |
(0.11) |
||
| Net income attributable to SLB, excluding charges & credits |
$1,306 |
$252 |
$38 |
$1,016 |
$0.74 |
||
|
(Stated in millions, except per share amounts) |
|||||||
| Six Months 2026 | |||||||
| Pretax | Tax | Noncont. Interests |
Net | Diluted EPS |
|||
| Net income attributable to SLB (GAAP basis) |
$1,975 |
$399 |
$38 |
$1,538 |
$1.02 |
||
| Merger and integration (1) |
110 |
27 |
5 |
78 |
0.05 |
||
| Net income attributable to SLB, excluding charges & credits |
$2,085 |
$426 |
$43 |
$1,616 |
$1.07 |
||
| Six Months 2025 | |||||||
| Pretax | Tax | Noncont. Interests |
Net | Diluted EPS * |
|||
| Net income attributable to SLB (GAAP basis) |
$2,348 |
$471 |
$66 |
$1,811 |
$1.32 |
||
| Workforce reductions (2) |
224 |
14 |
– |
210 |
0.15 |
||
| Merger & integration (1) |
84 |
4 |
8 |
72 |
0.05 |
||
| Impairment of equity method investment (2) |
69 |
12 |
– |
57 |
0.04 |
||
| Gain on sale of Palliser APS project (3) |
(149) |
(4) |
– |
(145) |
(0.11) |
||
| Net income attributable to SLB, excluding charges & credits |
$2,576 |
$497 |
$74 |
$2,005 |
$1.46 |
||
| * Does not add due to rounding | ||
|
|
|
|
|
(1) |
Classified in Merger & integration in the Condensed Consolidated Statement of Income. |
|
|
(2) |
Classified in Restructuring & other in the Condensed Consolidated Statement of Income. |
|
|
(3) |
Classified in Interest & other income in the Condensed Consolidated Statement of Income. |
|
Divisions
| (Stated in millions) | |||||||||||
| Second Quarter 2026 | First Quarter 2026 | Second Quarter 2025 | |||||||||
| Revenue | Income Before Taxes |
Revenue | Income Before Taxes |
Revenue | Income Before Taxes |
||||||
| Digital |
$697 |
$194 |
$640 |
$134 |
$591 |
$153 |
|||||
| Reservoir Performance |
1,556 |
232 |
1,594 |
257 |
1,691 |
314 |
|||||
| Well Construction |
2,742 |
417 |
2,797 |
424 |
2,963 |
551 |
|||||
| Production Systems |
3,771 |
586 |
3,508 |
497 |
2,932 |
491 |
|||||
| All Other |
505 |
142 |
443 |
113 |
583 |
155 |
|||||
| Eliminations & other |
(299) |
(167) |
(261) |
(104) |
(214) |
(80) |
|||||
| Pretax segment operating income |
1,404 |
$1,321 |
1,584 |
||||||||
| Corporate & other |
(211) |
(228) |
(169) |
||||||||
| Interest income(1) |
23 |
20 |
30 |
||||||||
| Interest expense(1) |
(128) |
(116) |
(139) |
||||||||
| Charges & credits(2) |
(69) |
(41) |
(21) |
||||||||
|
$8,972 |
$1,019 |
$8,721 |
$956 |
$8,546 |
$1,285 |
||||||
| (Stated in millions) | |||||||
| Six Months Ended | |||||||
| Jun. 30, 2026 | Jun. 30, 2025 | ||||||
| Revenue | Income Before Taxes |
Revenue | Income Before Taxes |
||||
| Digital |
$1,337 |
$328 |
$1,177 |
$278 |
|||
| Reservoir Performance |
3,150 |
489 |
3,391 |
596 |
|||
| Well Construction |
5,539 |
841 |
5,940 |
1,140 |
|||
| Production Systems |
7,279 |
1,083 |
5,773 |
962 |
|||
| All Other |
948 |
255 |
1,145 |
317 |
|||
| Eliminations & other |
(560) |
(271) |
(391) |
(153) |
|||
| Pretax segment operating income |
2,725 |
3,140 |
|||||
| Corporate & other |
(439) |
(347) |
|||||
| Interest income(1) |
43 |
66 |
|||||
| Interest expense(1) |
(244) |
(283) |
|||||
| Charges & credits(2) |
(110) |
(228) |
|||||
|
$17,693 |
$1,975 |
$17,035 |
$2,348 |
||||
|
(Stated in millions) |
|||||||||
| Second Quarter 2026 | |||||||||
| Revenue | Income Before Taxes |
Depreciation and Amortization (3) |
Net Interest Expense (Income) (4) |
Adjusted EBITDA (5) |
|||||
| Digital |
$697 |
$194 |
$48 |
$- |
$242 |
||||
| Reservoir Performance |
1,556 |
232 |
118 |
(1) |
349 |
||||
| Well Construction |
2,742 |
417 |
161 |
– |
578 |
||||
| Production Systems |
3,771 |
586 |
152 |
– |
738 |
||||
| All Other |
505 |
142 |
85 |
– |
227 |
||||
| Eliminations & other |
(299) |
(167) |
71 |
(5) |
(101) |
||||
| Pretax segment operating income |
1,404 |
||||||||
| Corporate & other |
(211) |
77 |
(134) |
||||||
| Interest income (1) |
23 |
||||||||
| Interest expense (1) |
(128) |
||||||||
| Charges & credits (2) |
(69) |
||||||||
|
$8,972 |
$1,019 |
$712 |
$(6) |
$1,899 |
|||||
|
(Stated in millions) |
|||||||||
| First Quarter 2026 | |||||||||
| Revenue | Income Before Taxes |
Depreciation and Amortization (3) |
Net Interest Expense (Income) (4) |
Adjusted EBITDA (5) |
|||||
| Digital |
$640 |
$134 |
$33 |
$- |
$167 |
||||
| Reservoir Performance |
1,594 |
257 |
113 |
(1) |
369 |
||||
| Well Construction |
2,797 |
424 |
161 |
(1) |
584 |
||||
| Production Systems |
3,508 |
497 |
152 |
(1) |
648 |
||||
| All Other |
443 |
113 |
84 |
– |
197 |
||||
| Eliminations & other |
(261) |
(104) |
69 |
(2) |
(37) |
||||
| Pretax segment operating income |
1,321 |
||||||||
| Corporate & other |
(228) |
73 |
(155) |
||||||
| Interest income (1) |
20 |
||||||||
| Interest expense (1) |
(116) |
||||||||
| Charges & credits (2) |
(41) |
||||||||
|
$8,721 |
$956 |
$685 |
$(5) |
$1,773 |
|||||
|
(Stated in millions) |
|||||||||
| Second Quarter 2025 | |||||||||
| Revenue | Income Before Taxes |
Depreciation and Amortization (3) |
Net Interest Expense (Income) (4) |
Adjusted EBITDA (5) |
|||||
| Digital |
$591 |
$153 |
$33 |
$- |
$186 |
||||
| Reservoir Performance |
1,691 |
314 |
107 |
– |
421 |
||||
| Well Construction |
2,963 |
551 |
169 |
– |
720 |
||||
| Production Systems |
2,932 |
491 |
91 |
– |
582 |
||||
| All Other |
583 |
155 |
117 |
3 |
275 |
||||
| Eliminations & other |
(214) |
(80) |
71 |
(1) |
(10) |
||||
| Pretax segment operating income |
1,584 |
||||||||
| Corporate & other |
(169) |
45 |
(123) |
||||||
| Interest income (1) |
30 |
||||||||
| Interest expense (1) |
(139) |
||||||||
| Charges & credits (2) |
(21) |
||||||||
|
$8,546 |
$1,285 |
$633 |
$2 |
$2,051 |
|||||
|
(Stated in millions) |
|||||||||
| Six Months 2026 | |||||||||
| Revenue | Income Before Taxes |
Depreciation and Amortization (3) |
Net Interest Expense (Income) (4) |
Adjusted EBITDA (5) |
|||||
| Digital |
$1,337 |
$328 |
$81 |
$- |
$409 |
||||
| Reservoir Performance |
3,150 |
489 |
231 |
(2) |
718 |
||||
| Well Construction |
5,539 |
841 |
322 |
(1) |
1,162 |
||||
| Production Systems |
7,279 |
1,083 |
304 |
(1) |
1,386 |
||||
| All Other |
948 |
255 |
169 |
– |
424 |
||||
| Eliminations & other |
(560) |
(271) |
140 |
(7) |
(138) |
||||
| Pretax segment operating income |
2,725 |
||||||||
| Corporate & other |
(439) |
150 |
(289) |
||||||
| Interest income (1) |
43 |
||||||||
| Interest expense (1) |
(244) |
||||||||
| Charges & credits (2) |
(110) |
||||||||
|
$17,693 |
$1,975 |
$1,397 |
$(11) |
$3,672 |
|||||
|
(Stated in millions) |
|||||||||
| Six Months 2025 | |||||||||
| Revenue | Income Before Taxes |
Depreciation and Amortization (3) |
Net Interest Expense (Income) (4) |
Adjusted EBITDA (5) |
|||||
| Digital |
$1,177 |
$278 |
$89 |
$- |
$367 |
||||
| Reservoir Performance |
3,391 |
596 |
211 |
(1) |
806 |
||||
| Well Construction |
5,940 |
1,140 |
333 |
(1) |
1,472 |
||||
| Production Systems |
5,773 |
962 |
181 |
– |
1,143 |
||||
| All Other |
1,145 |
317 |
227 |
7 |
551 |
||||
| Eliminations & other |
(391) |
(153) |
142 |
1 |
(10) |
||||
| Pretax segment operating income |
3,140 |
||||||||
| Corporate & other |
(347) |
90 |
(257) |
||||||
| Interest income (1) |
66 |
||||||||
| Interest expense (1) |
(283) |
||||||||
| Charges & credits (2) |
(228) |
||||||||
|
$17,035 |
$2,348 |
$1,273 |
$6 |
$4,072 |
|||||
|
(1) |
Excludes amounts which are included in the segments’ results. |
|
|
(2) |
See section entitled “Charges & Credits” for details. |
|
|
(3) |
Includes depreciation of fixed assets and amortization of intangible assets, APS and exploration data costs. |
|
|
(4) |
Excludes interest income and interest expense recorded at the corporate level. |
|
|
(5) |
Adjusted EBITDA represents income before taxes excluding depreciation and amortization, interest income, interest expense and charges & credits. |
Supplementary Information
Frequently Asked Questions
|
1) |
What is the capital investment guidance for the full-year 2026? |
|
|
Capital investment (consisting of capex, exploration data costs and APS investments) for the full-year 2026 is still expected to be approximately $2.5 billion. Capital investment for the full-year 2025 was $2.4 billion. |
|
|
|
|
2) |
What were the cash flow from operations and free cash flow for the second quarter of 2026? |
|
|
Cash flow from operations for the second quarter of 2026 was $1.36 billion and free cash flow was $716 million. |
|
|
|
|
3) |
What was included in “Interest & other income” for the second quarter of 2026? |
|
|
“Interest & other income” for the second quarter of 2026 was $76 million. This consisted of interest income of $29 million and earnings of equity method investments of $47 million. |
|
|
|
|
4) |
How did interest income and interest expense change during the second quarter of 2026? |
|
|
Interest income of $29 million for the second quarter of 2026 increased $3 million sequentially. Interest expense of $128 million increased $12 million sequentially. |
|
|
|
|
5) |
What was the effective tax rate (ETR) for the second quarter of 2026? |
|
|
The ETR for the second quarter of 2026, calculated in accordance with GAAP, was 20.0% as compared to 20.3% for the first quarter of 2026. Excluding charges and credits, the ETR for the second quarter of 2026 was 20.5% as compared to 20.3% for the first quarter of 2026. |
|
|
|
|
6) |
How many shares of common stock were outstanding as of June 30, 2026, and how did this change from the end of the previous quarter? |
|
|
There were 1.484 billion shares of common stock outstanding as of June 30, 2026, and 1.495 billion shares outstanding as of March 31, 2026. |
|
(Stated in millions) |
|||||
| Shares outstanding at March 31, 2026 |
1,495 |
||||
| Shares issued to optionees, less shares exchanged |
1 |
||||
| Vesting of restricted stock |
– |
||||
| Stock repurchase program |
(12) |
||||
| Shares outstanding at June 30, 2026 |
1,484 |
||||
|
7) |
What was the weighted average number of shares outstanding during the second quarter of 2026 and first quarter of 2026? How does this reconcile to the average number of shares outstanding, assuming dilution, used in the calculation of diluted earnings per share? |
|
|
The weighted average number of shares outstanding was 1.490 billion during the second quarter of 2026 and 1.499 billion during the first quarter of 2026. The following is a reconciliation of the weighted average shares outstanding to the average number of shares outstanding, assuming dilution, used in the calculation of diluted earnings per share. |
| (Stated in millions) | ||||||
| Second Quarter 2026 |
First Quarter 2026 |
|||||
| Weighted average shares outstanding |
1,490 |
1,499 |
||||
| Unvested restricted stock |
15 |
15 |
||||
| Assumed exercise of stock options |
1 |
1 |
||||
| Average shares outstanding, assuming dilution |
1,506 |
1,515 |
||||
|
8) |
What was SLB’s adjusted EBITDA in the second quarter of 2026, the first quarter of 2026, the second quarter of 2025, the first six months of 2026, and the first six months of 2025? What was SLB’s adjusted EBITDA margin for those periods? |
|
|
SLB’s adjusted EBITDA was $1.899 billion in the second quarter of 2026, $1.773 billion in the first quarter of 2026, and $2.051 billion in the second quarter of 2025. |
|
|
|
|
|
SLB’s adjusted EBITDA margin was 21.2% in the second quarter of 2026, 20.3% in the first quarter of 2026, and 24.0% in the second quarter of 2025, and was calculated as follows: |
| (Stated in millions) | |||||||
| Second Quarter 2026 |
First Quarter 2026 |
Second Quarter 2025 |
|||||
| Net income attributable to SLB |
$786 |
$752 |
$1,014 |
||||
| Net income attributable to noncontrolling interests |
29 |
9 |
34 |
||||
| Tax expense |
204 |
195 |
237 |
||||
| Income before taxes |
$1,019 |
$956 |
$1,285 |
||||
| Charges & credits |
69 |
41 |
21 |
||||
| Depreciation and amortization |
712 |
685 |
633 |
||||
| Interest expense |
128 |
116 |
142 |
||||
| Interest income |
(29) |
(25) |
(30) |
||||
| Adjusted EBITDA |
$1,899 |
$1,773 |
$2,051 |
||||
| Revenue |
$8,972 |
$8,721 |
$8,546 |
||||
| Adjusted EBITDA margin |
21.2% |
20.3% |
24.0% |
||||
|
SLB’s adjusted EBITDA was $3.672 billion in the first six months of 2026 and $4.072 billion in the first six months of 2025. SLB’s adjusted EBITDA margin was 20.8% in the first six months of 2026 and 23.9% in the first six months of 2025, and was calculated as follows: |
|||||||
| (Stated in millions) | |||||||
| Six Months 2026 |
Six Months 2025 |
Change |
|||||
| Net income attributable to SLB |
$1,538 |
$1,811 |
|||||
| Net income attributable to noncontrolling interests |
38 |
66 |
|||||
| Tax expense |
399 |
471 |
|||||
| Income before taxes |
$1,975 |
$2,348 |
|||||
| Charges & credits |
110 |
228 |
|||||
| Depreciation and amortization |
1,397 |
1,273 |
|||||
| Interest expense |
244 |
289 |
|||||
| Interest income |
(54) |
(66) |
|||||
| Adjusted EBITDA |
$3,672 |
$4,072 |
-10% |
||||
| Revenue |
$17,693 |
17,035 |
4% |
||||
| Adjusted EBITDA margin |
20.8% |
23.9% |
-315 bps |
||||
|
9) |
What were the components of depreciation and amortization expenses for the second quarter of 2026, the first quarter of 2026, the second quarter of 2025, the first six months of 2026, and the first six months of 2025? |
|
|
The components of depreciation and amortization expenses for the second quarter of 2026, the first quarter of 2026, and the second quarter of 2025 were as follows: |
| (Stated in millions) | |||||||
| Second Quarter 2026 |
First Quarter 2026 |
Second Quarter 2025 |
|||||
| Depreciation of fixed assets |
$473 |
$464 |
$408 |
||||
| Amortization of intangible assets |
111 |
110 |
82 |
||||
| Amortization of APS investments |
83 |
82 |
115 |
||||
| Amortization of exploration data costs capitalized |
45 |
29 |
28 |
||||
|
$712 |
$685 |
$633 |
|||||
|
The components of depreciation and amortization expenses for the first six months of 2026 and the first six months of 2025 were as follows: |
|||||
| (Stated in millions) | |||||
| Six Months 2026 |
Six Months 2025 |
||||
| Depreciation of fixed assets |
$937 |
$805 |
|||
| Amortization of intangible assets |
$221 |
$164 |
|||
| Amortization of APS investments |
$165 |
$225 |
|||
| Amortization of exploration data costs capitalized |
$74 |
$79 |
|||
|
$1,397 |
$1,273 |
||||
|
10) |
What are the revenue categories in the Digital Division that offer solutions to SLB’s customers? |
|
|
Within Digital, revenue is generated from four key solutions — Platforms & Applications, Digital Operations, Digital Exploration and Professional Services. |
|
|
|
|
|
Platforms & Applications includes SLB’s cloud technologies such as the Delfi™ and Lumi™ platforms, along with a suite of specialized, domain-focused applications such as Petrel™ and Techlog™ offered as SaaS subscription or perpetual licenses. These platforms and applications automate complex models to simulate the impact of reservoir development plans and aid in the planning of key operations such as drilling, completion and production designs. Additionally, they unlock data and utilize AI and machine learning to reduce cycle time and improve efficiency of workflows to allow customers to make better, faster decisions to improve their project economics and reservoir performance. |
|
|
|
|
|
Revenue is recurring (with exception of one-off license sales) underpinned by a substantial base of ARR from a globally installed base, complemented by customer adoption of new cloud-based capabilities and IoT-enabled solutions. |
|
|
|
|
|
This category has best-in-class retention rates and limited churn. |
|
|
|
|
|
Digital Operations combines the unique strengths of SLB’s oilfield services with advanced digital technologies to deliver more reliable, efficient and autonomous field operations. By integrating connected solutions with Performance Live™ digital service delivery centers, customers gain real-time monitoring, remote decision making and automated execution across their workflows from autonomous drilling to automated well intervention, all while reducing costs and improving project economics. |
|
|
|
|
|
Revenue is generated from the same customer base as the Core divisions and is, therefore, repeatable. Additionally, a portion of the revenue is recurring in nature. |
|
|
|
|
|
To incentivize the Core divisions — Well Construction, Reservoir Performance and Production Systems — and Digital to develop and promote this category, the resulting revenue is recognized in both the respective Core division as well as in the Digital Division. This effect is eliminated in consolidation. |
|
|
|
|
|
Digital Exploration represents SLB’s exploration data business. The exploration data library is a differentiated asset library of seismic surveys and other subsurface data that customers rely on for better exploration and development decisions. These licensed datasets also support carbon storage design and monitoring. The library covers key exploration and producing basins worldwide and datasets are refreshed and reprocessed to benefit from the latest imaging algorithms and AI technologies, enabled by high performance cloud computing. |
|
|
|
|
|
Revenue is generated from one-time, non-transferable license sales and is therefore non-recurring in nature. |
|
|
|
|
|
Professional Services includes consulting and other services required to support customers’ digital transformations. These services include transition support from on-prem to cloud-based digital solutions, data clean-up and migration, workflow automation — including deployment of workflow solutions built within SLB’s global network of Innovation Factori workspaces — and training to further enable customers’ digital transformations. |
|
|
|
|
|
Revenue in this category is largely project-based, and repetitive engagements with the same customers are common. These services generate pull-through opportunities across other digital revenue streams. |
|
11) |
How much revenue was generated from each of the categories comprising the Digital Division in the first six months of 2026 and the first six months of 2025? What is the pretax operating income and adjusted EBITDA of the Digital Division for those periods? |
|
Digital revenue, pretax operating income, and adjusted EBITDA in the first six months of 2026 and first six months of 2025 are detailed as follows: |
| Six Months Ended | Change | |||||
| Jun. 30, 2026 |
Jun. 30, 2025 |
Year-on-year | ||||
| Revenue | ||||||
| Platforms & Applications |
$499 |
$502 |
-1% |
|||
| Digital Operations |
291 |
171 |
70% |
|||
| Digital Exploration |
227 |
173 |
32% |
|||
| Professional Services |
320 |
331 |
-4% |
|||
|
$1,337 |
$1,177 |
14% |
||||
|
|
||||||
| Pretax operating income |
$328 |
$278 |
18% |
|||
| Pretax operating margin |
24.5% |
23.6% |
93 bps |
|||
|
|
||||||
| Adjusted EBITDA |
$409 |
$367 |
12% |
|||
| Adjusted EBITDA margin |
30.6% |
31.1% |
-56 bps |
|||
|
12) |
In Digital, what is the definition of ARR and what was the ARR as of June 30, 2026, March 31, 2026, and June 30, 2025? |
|
|
ARR represents the annual value of recurring subscription and maintenance revenues from Platforms & Applications, along with the recurring portion of Digital Operations, providing a measure of predictable revenue over the next 12 months. This is calculated based on the trailing twelve months revenue and excludes one-time license sales and variable usage fees. |
|
|
|
|
|
ARR as of June 30, 2026, was $1.04 billion, compared to $1.02 billion as of March 31, 2026, and $904 million as of June 30, 2025, resulting in a 15% increase year on year and 1% increase sequentially. |
|
|
|
|
13) |
What is the Data Center Solutions business and where is it reported? |
|
|
The Data Center Solutions business designs and manufactures critical infrastructure components — such as modular data center enclosures, cooling systems and other hardware — for hyperscalers and enterprises. By leveraging scalable, standardized production with rapid lead times, and rigorous quality assurance, SLB provides configurable solutions that balance cost efficiency, reliability and customization to meet accelerating data center demand. |
|
|
|
|
|
AI-driven data demand is fueling rapid growth, and this business is going to be a material and meaningful contributor to SLB’s portfolio in the future. This business is reported in the All Other category. |
|
|
|
|
14) |
How much revenue was generated from the Data Center Solutions business for the second quarter of 2026, the first quarter of 2026, the second quarter of 2025, the first six months of 2026, and the first six months of 2025? |
|
|
Data Center Solutions revenue was $186 million in the second quarter of 2026, $141 million in the first quarter of 2026, and $104 million in the second quarter of 2025, resulting in a 33% increase sequentially and 80% increase year on year. |
|
|
|
|
|
Data Center Solutions revenue was $327 million in the first six months of 2026 and $201 million in the first six months of 2025, resulting in a 63% increase year on year. |
|
|
|
|
15) |
What Divisions comprise SLB’s Core business and what were their revenue and pretax operating income for the second quarter of 2026, the first quarter of 2026, and the second quarter of 2025? |
|
|
SLB’s Core business comprises the Reservoir Performance, Well Construction, and Production Systems Divisions. SLB’s Core business revenue and pretax operating income for the second quarter of 2026, the first quarter of 2026, and the second quarter of 2025 are calculated as follows: |
| (Stated in millions) | ||||||||||
| Three Months Ended | Change | |||||||||
| Jun. 30, 2026 |
Mar. 31, 2026 |
Jun. 30, 2025 |
Sequential | Year-on-year | ||||||
| Revenue | ||||||||||
| Reservoir Performance |
$1,556 |
$1,594 |
$1,691 |
|||||||
| Well Construction |
2,742 |
2,797 |
2,963 |
|||||||
| Production Systems |
3,771 |
3,508 |
2,932 |
|||||||
|
$8,069 |
$7,899 |
$7,586 |
2% |
|
6% |
|||||
|
|
|
|
||||||||
| Pretax Operating Income |
|
|
|
|||||||
| Reservoir Performance |
$232 |
$257 |
$314 |
|
|
|
||||
| Well Construction |
417 |
424 |
551 |
|
|
|
||||
| Production Systems |
586 |
497 |
491 |
|
|
|
||||
|
$1,235 |
$1,177 |
$1,357 |
5% |
|
-9% |
|||||
|
|
|
|
||||||||
| Pretax Operating Margin |
|
|
|
|||||||
| Reservoir Performance |
14.9% |
16.1% |
18.6% |
|
|
|
||||
| Well Construction |
15.2% |
15.2% |
18.6% |
|
|
|
||||
| Production Systems |
15.5% |
14.2% |
16.7% |
|
|
|
||||
|
15.3% |
14.9% |
17.9% |
40 bps |
|
-258 bps |
|||||
|
Second-quarter 2026 results reflect activity from ChampionX, which contributed $865 million of revenue to Production Systems. Excluding the impact of this acquisition, Core revenue decreased 5% year on year. |
||||||||||
About SLB
SLB (NYSE: SLB) is a global technology company that has driven energy innovation for 100 years. With a global presence in more than 100 countries and employees representing almost twice as many nationalities, we work each day on innovating oil and gas, delivering digital at scale, decarbonizing industries, and developing and scaling new energy systems that accelerate the energy transition. Find out more at slb.com.
Conference Call Information
SLB will hold a conference call to discuss the earnings press release and business outlook on Friday, July 24, 2026. The call is scheduled to begin at 9:30 a.m. U.S. Eastern time. To access the call, which is open to the public, please contact the conference call operator at +1 (800) 715-9871 within North America, or +1 (646) 307-1963 outside of North America, approximately 10 minutes prior to the call’s scheduled start time, and provide the access code 3440360. At the conclusion of the conference call, an audio replay will be available until July 31, 2026, by dialling +1 (800) 770-2030 within North America, or +1 (609) 800-9909 outside of North America, and providing the access code 3440360. The conference call will be webcasted simultaneously at https://events.q4inc.com/attendee/157027565 on a listen-only basis. A replay of the webcast will also be available at the same website until July 31, 2026.
Forward-Looking Statements
This second-quarter 2026 earnings press release, as well as other statements we make, contain “forward-looking statements” within the meaning of the federal securities laws, which include any statements that are not historical facts. Such statements often contain words such as “expect,” “may,” “can,” “believe,” “predict,” “plan,” “potential,” “projected,” “projections,” “precursor,” “forecast,” “outlook,” “expectations,” “estimate,” “intend,” “anticipate,” “ambition,” “goal,” “target,” “scheduled,” “think,” “should,” “could,” “would,” “will,” “see,” “likely,” and other similar words. Forward-looking statements address matters that are, to varying degrees, uncertain, such as statements about our financial and performance targets and other forecasts or expectations regarding, or dependent on, our business outlook; growth for SLB as a whole and for each of its Divisions (and for specified business lines, geographic areas, or technologies within each Division); the benefits of the ChampionX acquisition, including the ability of SLB to integrate the ChampionX business successfully and to achieve anticipated synergies and value creation from the acquisition; oil and natural gas demand and production growth; oil and natural gas prices; forecasts or expectations regarding energy transition and global climate change; improvements in operating procedures and technology; capital expenditures by SLB and the oil and gas industry; our business strategies, including digital and “fit for basin,” as well as the strategies of our customers; our capital allocation plans, including dividend plans and share repurchase programs; our APS projects, joint ventures, and other alliances; the impact of the ongoing or escalating conflicts on global energy supply; access to raw materials; future global economic and geopolitical conditions; future liquidity, including free cash flow; and future results of operations, such as margin levels. These statements are subject to risks and uncertainties, including, but not limited to, changing global economic and geopolitical conditions; changes in exploration and production spending by our customers, and changes in the level of oil and natural gas exploration and development; the results of operations and financial condition of our customers and suppliers; the inability to achieve our financial and performance targets and other forecasts and expectations; the inability to achieve our net-zero carbon emissions goals or interim emissions reduction goals; general economic, geopolitical, and business conditions in key regions of the world; foreign currency risk; inflation; changes in monetary policy by governments; tariffs; pricing pressure; weather and seasonal factors; unfavorable effects of health pandemics; availability and cost of raw materials; operational modifications, delays, or cancellations; challenges in our supply chain; production declines; the extent of future charges; the inability to recognize efficiencies and other intended benefits from our business strategies and initiatives, such as digital or new energy, as well as our cost reduction strategies; changes in government regulations and regulatory requirements, including those related to offshore oil and gas exploration, radioactive sources, explosives, chemicals, and climate-related initiatives; the inability of technology to meet new challenges in exploration; the competitiveness of alternative energy sources or product substitutes; and other risks and uncertainties detailed in this press release and our most recent Forms 10-K, 10-Q, and 8-K filed with or furnished to the Securities and Exchange Commission (the “SEC”).
If one or more of these or other risks or uncertainties materialize (or the consequences of any such development changes), or should our underlying assumptions prove incorrect, actual results or outcomes may vary materially from those reflected in our forward-looking statements. Forward-looking and other statements in this press release regarding our environmental, social, and other sustainability plans and goals are not an indication that these statements are necessarily material to investors or required to be disclosed in our filings with the SEC. In addition, historical, current, and forward-looking environmental, social, and sustainability-related statements may be based on standards for measuring progress that are still developing, internal controls and processes that continue to evolve, and assumptions that are subject to change in the future. Statements in this press release are made as of the date of this release, and SLB disclaims any intention or obligation to update publicly or revise such statements, whether as a result of new information, future events, or otherwise.
View source version on businesswire.com: https://www.businesswire.com/news/home/20260722694386/en/
Media gallery


